App Inspector
This documentation is for an earlier version of the App Inspector. For the post version 5 App Inspector see here.
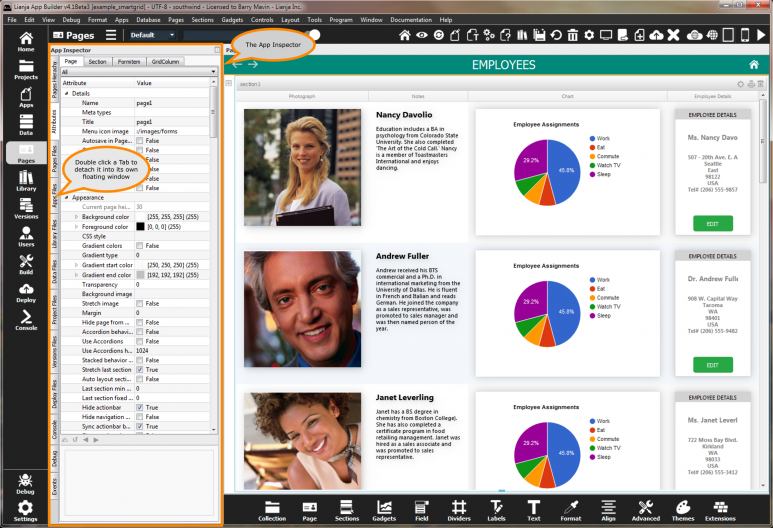
The App Inspector is your best friend during development as it provides a complete overview of your App.
It is organized into Tabs. Each Tab is relevant to a particular workspace. You can double click a Tab to detach it into its own floating window.
Clicking the small icon on the far right of the App Inspector title bar will detach it into its own floating window.
Double clicking the window title bar when it is floating will attach it back into place.
Select the "Pages" workspace.
Select the "Pages Files" in the App Inspector.
Drag a table onto the page to create a Form Section.
Shift+Drag a table onto the page to create a Grid section.
Customize its appearance by editing "Attributes" in its Attributes Tab.
Customize its behavior by editing "Custom Delegates" in its "Attributes" Tab.
The Tabs in the App Inspector from top to bottom are as follows.
| Tab | Description |
|---|---|
| Pages Hierarchy | Contains a hierarchical tree view of the Pages, Sections, FormItems and Delegates. Click a Page, Section or Formitem and it will be selected in the Page Builder. Double click an event delegate to edit it in the Script Editor. |
| Attributes | Contains the App Attributes for Pages, Sections, FormItems and GridColumns. Select from the ComboBox at the top to filter attributes by category. From Lianja v4.2, the App Settings are also included in the Attributes Tab. |
| Pages Files | Contains file lists pertaining to the Pages Workspace. |
| Apps Files | Contains file lists pertaining to the Apps Workspace. |
| Library Files | Contains a file list pertaining to the Library Workspace. |
| Data Files | Contains file lists pertaining to the Data Workspace. |
| Project Files | Contains a file list pertaining to the Projects Workspace. |
| Versions Files | Contains file lists pertaining to the Versions Workspace. |
| Deploy Files | Contains a file list pertaining to the Deploy Workspace. |
| Console | Contains an embedded console for all supported scripting languages. Double click to detach if you want to use it in runtime mode to assist with debugging. As of Lianja 5 the Console tab has been removed from the App Inspector. The Command Window can be opened from the System Menu. |
| Debug | Contains the Lianja/VFP Debugger. As of Lianja 5 the Debug tab has been removed from the App Inspector and replaced by the “Debugger” Tab in the “Troubleshooter”. |
| Events | Contains event tracing for runtime code. Double click to detach if you want to see how events are fired and handled in your code in runtime mode. Execution time for each event is also displayed making this an invaluable tool for performance tuning in your App. As of Lianja 5 the Events tab has been removed from the App Inspector and replaced by the “Performance Metrics” Tab in the “Troubleshooter”. |
The App Inspector has a tabbed UI.
Double click a Tab and it will be detached into its own floating window.
Double click the window title bar and it will be attached back as a Tab.
Switching between workspaces will automatically select the Tab for that workspace.
Pages in category "App Inspector"
The following 15 pages are in this category, out of 15 total.
