Difference between revisions of "Troubleshooter Debugger Tab"
Yvonne.milne (Talk | contribs) (Created page with "''Under Construction. Coming soon in Lianja v5.0''' ==The Troubleshooter== The Troubleshooter ... {{ns:file}}:troubleshooter_intro.png|800px|left|link={{filepath:troubles...") |
Yvonne.milne (Talk | contribs) (→See Also) |
||
| (30 intermediate revisions by the same user not shown) | |||
| Line 1: | Line 1: | ||
| − | |||
| − | |||
==The Troubleshooter== | ==The Troubleshooter== | ||
| − | The Troubleshooter | + | The Troubleshooter provides a tabbed interface bringing together debugging, tracing and performance metrics to assist you in testing and tuning your Apps. |
| − | [[{{ns:file}}: | + | [[{{ns:file}}:troubleshooter_debugger.png|800px|left|border|link={{filepath:troubleshooter_debugger.png}}|Troubleshooter]] |
<br clear=all> | <br clear=all> | ||
| Line 23: | Line 21: | ||
It can also be opened in the following ways: | It can also be opened in the following ways: | ||
| − | * Clicking on '''Debug''' in the [[Media: | + | * Clicking on '''Debug''' in the [[Media:L5_getstart1_2.png|Modebar]]. |
* Automatically, when a running program issues the [[DEBUGGER|debugger]] command. | * Automatically, when a running program issues the [[DEBUGGER|debugger]] command. | ||
* Issuing the command [[DEBUG|debug]] ''<filename>'' or [[DEBUGGER|debugger]] ''<filename>'' in the Lianja/VFP Command Window ([[Console Workspace]] or [[Command Window]]). | * Issuing the command [[DEBUG|debug]] ''<filename>'' or [[DEBUGGER|debugger]] ''<filename>'' in the Lianja/VFP Command Window ([[Console Workspace]] or [[Command Window]]). | ||
| Line 32: | Line 30: | ||
Programs can also be loaded from the [[Apps Workspace]]. Open the file (double-click the filename) in the [[Script Editor]] then click the '''Open file in Debugger''' toolbutton. | Programs can also be loaded from the [[Apps Workspace]]. Open the file (double-click the filename) in the [[Script Editor]] then click the '''Open file in Debugger''' toolbutton. | ||
| − | [[{{ns:file}}: | + | [[{{ns:file}}:troubleshooter_debugger1.png|800px|left|border|link={{filepath:troubleshooter_debugger1.png}}|Open file in Debugger]] |
<br clear=all> | <br clear=all> | ||
| Line 39: | Line 37: | ||
Select the Debugger Tab or click '''Debug''' in the [[Media:Getstart1_2.png|Modebar]] then click '''Run/Continue''' in the [[#actionbar|actionbar]] to debug the file. | Select the Debugger Tab or click '''Debug''' in the [[Media:Getstart1_2.png|Modebar]] then click '''Run/Continue''' in the [[#actionbar|actionbar]] to debug the file. | ||
| − | [[{{ns:file}}: | + | [[{{ns:file}}:troubleshooter_debugger2.png|left|link={{filepath:troubleshooter_debugger2.png}}|Debugger Tab]] |
<br clear=all> | <br clear=all> | ||
| Line 48: | Line 46: | ||
Right-clicking in a loaded file displays the context menu: | Right-clicking in a loaded file displays the context menu: | ||
| − | [[{{ns:file}}:debug_tab_file_cm.png|left|link={{filepath:debug_tab_file_cm.png}}| | + | [[{{ns:file}}:debug_tab_file_cm.png|left|link={{filepath:debug_tab_file_cm.png}}|Debugger Tab]] |
<br clear=all> | <br clear=all> | ||
| Line 55: | Line 53: | ||
While the debugger is active, hovering the mouse over a command, function, field or variable will display its Intellitip with information about its usage, syntax or definition. For more about Intellitips and other Lianja CodeAssistant for Lianja/VFP features, see [[Script_Editor#The_Lianja_CodeAssistant_for_Lianja.2FVFP|Script Editor: The Lianja CodeAssistant]]. | While the debugger is active, hovering the mouse over a command, function, field or variable will display its Intellitip with information about its usage, syntax or definition. For more about Intellitips and other Lianja CodeAssistant for Lianja/VFP features, see [[Script_Editor#The_Lianja_CodeAssistant_for_Lianja.2FVFP|Script Editor: The Lianja CodeAssistant]]. | ||
| − | [[{{ns:file}}: | + | [[{{ns:file}}:troubleshooter_debugger3.png|left|link={{filepath:troubleshooter_debugger3.png}}|Debugger Tab]] |
<br clear=all> | <br clear=all> | ||
===Output=== | ===Output=== | ||
The Output panel displays program and [[#Command|Command Window]] output. | The Output panel displays program and [[#Command|Command Window]] output. | ||
| − | [[{{ns:file}}: | + | [[{{ns:file}}:troubleshooter_debugger4.png|left|link={{filepath:troubleshooter_debugger4.png}}|Debugger Tab]] |
<br clear=all> | <br clear=all> | ||
Right-clicking in the Output panel displays the context menu: | Right-clicking in the Output panel displays the context menu: | ||
| − | [[{{ns:file}}:debug_tab_output_cm.png|left|link={{filepath:debug_tab_output_cm.png}}| | + | [[{{ns:file}}:debug_tab_output_cm.png|left|link={{filepath:debug_tab_output_cm.png}}|Debugger Tab]] |
<br clear=all> | <br clear=all> | ||
| Line 78: | Line 76: | ||
===Breakpoints=== | ===Breakpoints=== | ||
| − | Breakpoints cause execution of the running program to pause before the line of code set as a breakpoint is run | + | Breakpoints cause execution of the running program to pause before the line of code set as a breakpoint is run or when the condition of a conditional breakpoint evaluates to true. |
| − | [[{{ns:file}}: | + | To set a conditional breakpoint, click '''Add Conditional Breakpoint''' in the [[#actionbar|actionbar]] and enter the condition in the dialog that is displayed. |
| + | |||
| + | [[{{ns:file}}:troubleshooter_debugger5.png|left|link={{filepath:troubleshooter_debugger5.png}}|Debugger Tab]] | ||
| + | <br clear=all> | ||
| + | |||
| + | Line breakpoints can be set and unset using the [[#actionbar|actionbar]] or by clicking in the line number column to the left of the selected line. | ||
| + | |||
| + | [[{{ns:file}}:troubleshooter_debugger6.png|left|link={{filepath:troubleshooter_debugger6.png}}|Debugger Tab]] | ||
<br clear=all> | <br clear=all> | ||
| Line 87: | Line 92: | ||
Click '''Remove All Breakpoints''' in the [[#actionbar|actionbar]] to clear all current breakpoints. | Click '''Remove All Breakpoints''' in the [[#actionbar|actionbar]] to clear all current breakpoints. | ||
| − | [[{{ns:file}}: | + | [[{{ns:file}}:troubleshooter_debugger7.png|left|link={{filepath:troubleshooter_debugger7.png}}|Debugger Tab]] |
| + | <br clear=all> | ||
| + | |||
| + | From v8.0, click '''Deactivate Breakpoints''' in the [[#actionbar|actionbar]] to disable breakpoints without removing them. Breakpoints can also be enabled/disabled using the [[SET BREAKPOINT]] command. | ||
| + | |||
| + | [[{{ns:file}}:troubleshooter_debugger7a.png|left|link={{filepath:troubleshooter_debugger7a.png}}|Debugger Tab]] | ||
<br clear=all> | <br clear=all> | ||
| Line 93: | Line 103: | ||
Watches (or 'watchpoints') cause execution of the running program to pause after the value of a field or memory variable set as a watchpoint changes. Watches are set using the [[#actionbar|actionbar]]: | Watches (or 'watchpoints') cause execution of the running program to pause after the value of a field or memory variable set as a watchpoint changes. Watches are set using the [[#actionbar|actionbar]]: | ||
| − | [[{{ns:file}}: | + | [[{{ns:file}}:troubleshooter_debugger8.png|left|link={{filepath:troubleshooter_debugger8.png}}|Debugger Tab]] |
<br clear=all> | <br clear=all> | ||
The Watchpoints grid shows the name, data type and current value for currently set watchpoints. Double-clicking on a grid row will clear that watchpoint. | The Watchpoints grid shows the name, data type and current value for currently set watchpoints. Double-clicking on a grid row will clear that watchpoint. | ||
| + | |||
| + | [[{{ns:file}}:troubleshooter_debugger9.png|left|link={{filepath:troubleshooter_debugger9.png}}|Debugger Tab]] | ||
| + | <br clear=all> | ||
Click '''Remove All Watches''' in the [[#actionbar|actionbar]] to clear all current watchpoints. | Click '''Remove All Watches''' in the [[#actionbar|actionbar]] to clear all current watchpoints. | ||
| − | [[{{ns:file}}: | + | [[{{ns:file}}:troubleshooter_debugger10.png|left|link={{filepath:troubleshooter_debugger10.png}}|Debugger Tab]] |
| + | <br clear=all> | ||
| + | |||
| + | From v8.0, click '''Deactivate watchpoints''' in the [[#actionbar|actionbar]] to disable watchpoints without removing them. | ||
| + | |||
| + | [[{{ns:file}}:troubleshooter_debugger10a.png|left|link={{filepath:troubleshooter_debugger10a.png}}|Debugger Tab]] | ||
<br clear=all> | <br clear=all> | ||
| Line 106: | Line 124: | ||
The Call Stack grid shows the filename and line number for each program in the current stack. | The Call Stack grid shows the filename and line number for each program in the current stack. | ||
| − | [[{{ns:file}}: | + | [[{{ns:file}}:troubleshooter_debugger11.png|left|link={{filepath:troubleshooter_debugger11.png}}|Debugger Tab]] |
<br clear=all> | <br clear=all> | ||
===Globals=== | ===Globals=== | ||
| − | + | The Globals grid shows the name, type and value of current public variables. | |
===Locals=== | ===Locals=== | ||
| + | The Locals grid shows the name, type and value of current local and private variables. | ||
| + | [[{{ns:file}}:troubleshooter_debugger13.png|left|link={{filepath:troubleshooter_debugger13.png}}|Debugger Tab]] | ||
| + | <br clear=all> | ||
===Actionbar=== | ===Actionbar=== | ||
| Line 125: | Line 146: | ||
|- | |- | ||
|valign="top"|Stop | |valign="top"|Stop | ||
| − | |valign="top"|Stop debugging. | + | |valign="top"|Stop debugging. From v6.0 this also cancels the execution of the program. |
|- | |- | ||
|valign="top"|Edit Code | |valign="top"|Edit Code | ||
| Line 147: | Line 168: | ||
|valign="top"|Step Out | |valign="top"|Step Out | ||
|valign="top"|Run until returning to the calling program, then move to the next line. | |valign="top"|Run until returning to the calling program, then move to the next line. | ||
| + | |- | ||
| + | |valign="top"|Add Conditional Breakpoint | ||
| + | |valign="top"|Set a conditional breakpoint on a specified condition. A dialog will be displayed so the condition can be entered. | ||
|- | |- | ||
|valign="top"|Toggle Breakpoint | |valign="top"|Toggle Breakpoint | ||
| Line 159: | Line 183: | ||
|valign="top"|Remove All Watches | |valign="top"|Remove All Watches | ||
|valign="top"|Remove all watchpoints. | |valign="top"|Remove all watchpoints. | ||
| + | |- | ||
| + | |valign="top"|Deactivate/Activate Breakpoints | ||
| + | |valign="top"|Disable or enable breakpoints. From v8.0. | ||
| + | |- | ||
| + | |valign="top"|Deactivate/Activate Watchpoints | ||
| + | |valign="top"|Disable or enable watchpoints. From v8.0. | ||
|- | |- | ||
|valign="top"|List Status | |valign="top"|List Status | ||
| − | |valign="top"|[[LIST STATUS| | + | |valign="top"|[[LIST STATUS|List the current data environment]] in the Output window. |
|- | |- | ||
|valign="top"|List Memory | |valign="top"|List Memory | ||
| − | |valign="top"|[[LIST MEMORY| | + | |valign="top"|[[LIST MEMORY|List the current memory variables]] in the Output window. |
|- | |- | ||
|valign="top"|List Structure | |valign="top"|List Structure | ||
| − | |valign="top"|[[LIST STRUCTURE| | + | |valign="top"|[[LIST STRUCTURE|List the structure]] of the currently selected table or cursor in the Output window. |
|- | |- | ||
|valign="top"|Clear | |valign="top"|Clear | ||
| Line 175: | Line 205: | ||
==See Also== | ==See Also== | ||
| − | [[Command Window]], [[:Category:Error Handling|Error Handling and Debugging]], [[Script Editor]] | + | [[Command Window]], [[:Category:Error Handling|Error Handling and Debugging]], [[Script Editor]], [[SET BREAKPOINT]] |
| + | [[Category:Workspaces]] | ||
[[Category:Troubleshooter]] | [[Category:Troubleshooter]] | ||
[[Category:Error Handling]] | [[Category:Error Handling]] | ||
| + | [[Category:Lianja v5.0]] | ||
| + | [[Category:Lianja v8.0]] | ||
Latest revision as of 05:17, 3 October 2022
Contents
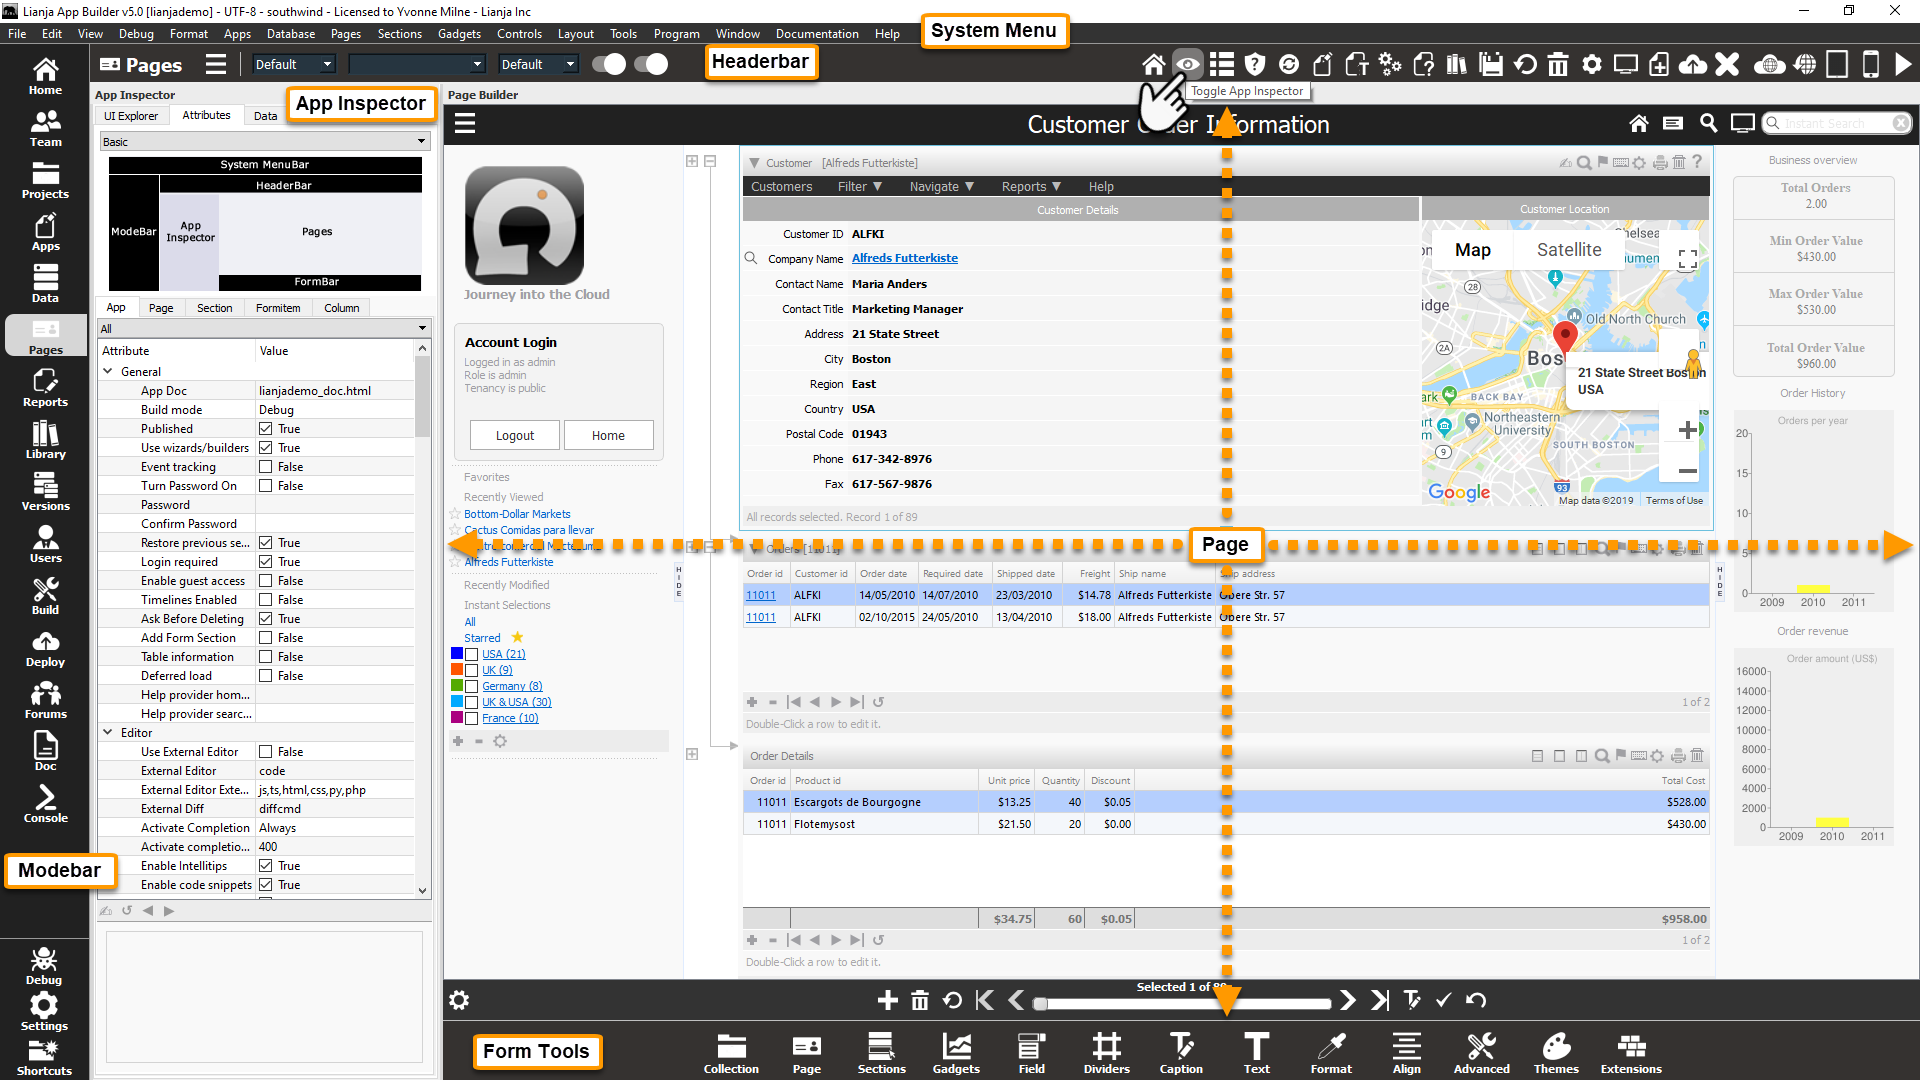
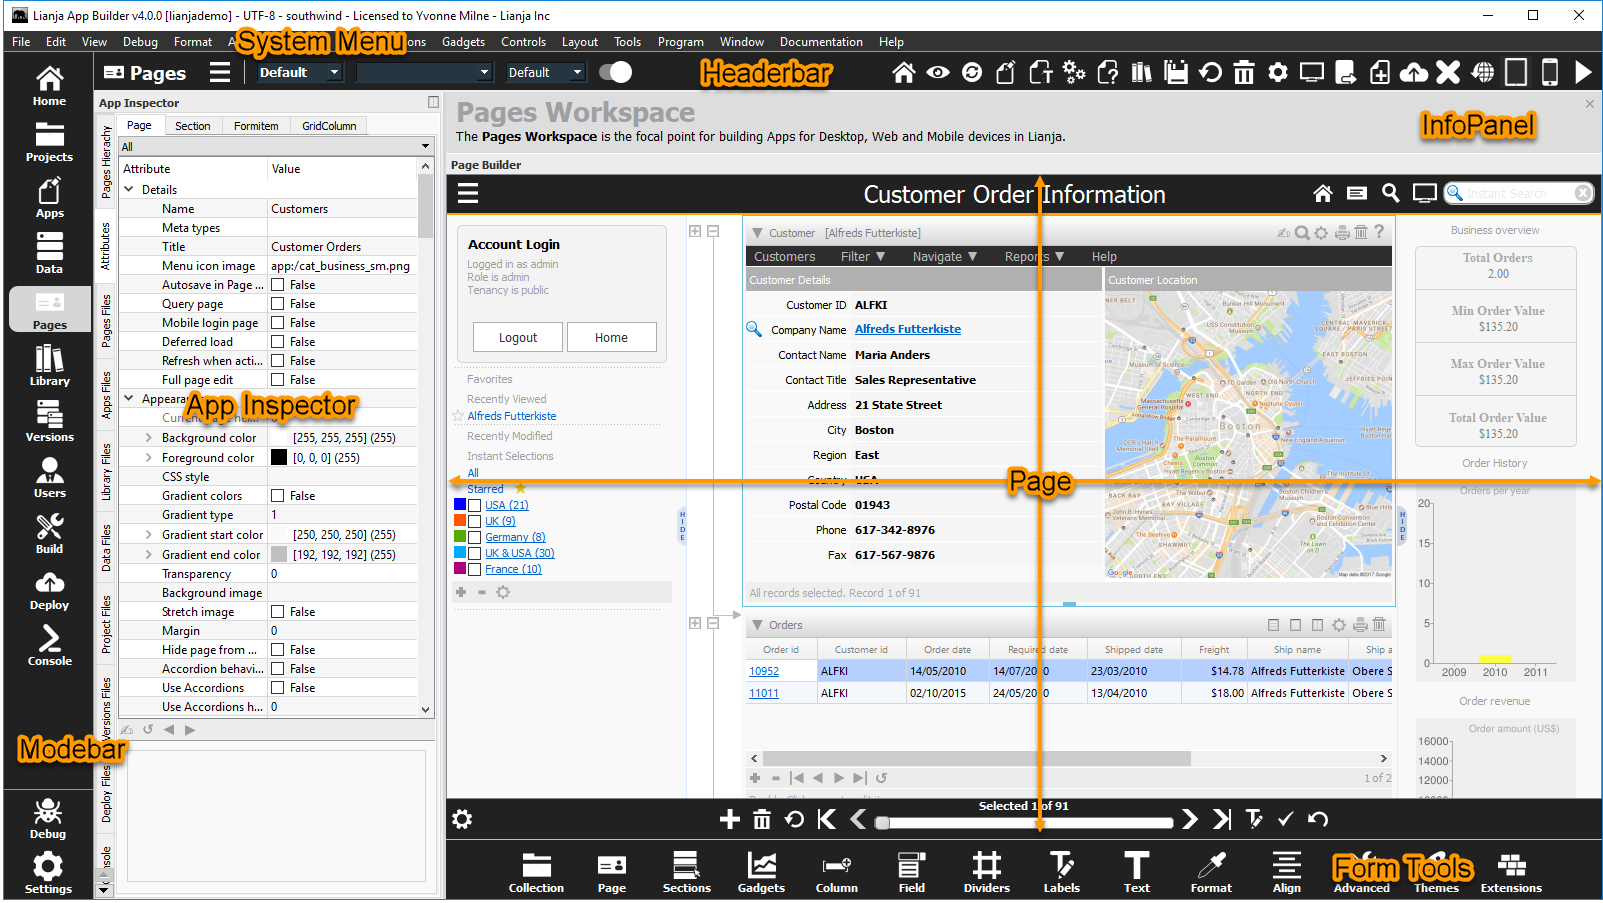
The Troubleshooter
The Troubleshooter provides a tabbed interface bringing together debugging, tracing and performance metrics to assist you in testing and tuning your Apps.

The Debugger Tab
The Debugger Tab contains the Lianja/VFP Debugger. The tabbed upper container contains an Output panel and the files currently loaded in the Debugger. The lower tabbed container contains the following:
- Command Window
- Breakpoints Grid
- Watches Grid
- Call Stack Grid
- Globals Grid
- Locals Grid
Below these are a message line showing the current operation and an actionbar.
Activating the Debugger
As with all Troubleshooter tabs, the Debugger Tab can be selected by clicking on its tab.
It can also be opened in the following ways:
- Clicking on Debug in the Modebar.
- Automatically, when a running program issues the debugger command.
- Issuing the command debug <filename> or debugger <filename> in the Lianja/VFP Command Window (Console Workspace or Command Window).
Loading Files in the Debugger
Programs containing the debugger command or specified with the debug <prg-filename> or debugger <prg-filename> commands are automatically loaded into the debugger when the command is issued.
Programs can also be loaded from the Apps Workspace. Open the file (double-click the filename) in the Script Editor then click the Open file in Debugger toolbutton.

Library files can be loaded from the Library Workspace in the same way: open the file (double-click the filename) in the Script Editor then click the Open file in Debugger toolbutton.
Select the Debugger Tab or click Debug in the Modebar then click Run/Continue in the actionbar to debug the file.

Note: if multiple files are loaded, the file in the leftmost tab will be debugged when Run/Continue is clicked.
Called programs are automatically loaded when referenced by a program being debugged and Step Into is clicked.
Right-clicking in a loaded file displays the context menu:
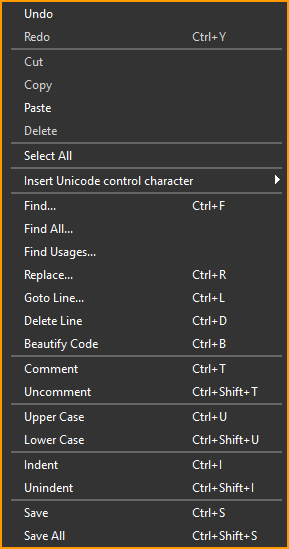
Note: some menu options only operate when the file is in edit mode. See actionbar below for how to switch mode.
While the debugger is active, hovering the mouse over a command, function, field or variable will display its Intellitip with information about its usage, syntax or definition. For more about Intellitips and other Lianja CodeAssistant for Lianja/VFP features, see Script Editor: The Lianja CodeAssistant.

Output
The Output panel displays program and Command Window output.

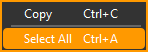
Right-clicking in the Output panel displays the context menu:
Command
The Debug Console contains a Lianja/VFP Command Window. All Lianja/VFP commands and functions can be used in the Command Window apart from flow control and looping commands and others that form a begin...end statement block.
Note also, as in the floating Command Window and Console Workspace:
- The semi-colon ';' line continuation character is not supported.
- & macro substitution is supported.
Output is displayed in the Output panel; errors are reported in the Error Viewer Tab.
Breakpoints
Breakpoints cause execution of the running program to pause before the line of code set as a breakpoint is run or when the condition of a conditional breakpoint evaluates to true.
To set a conditional breakpoint, click Add Conditional Breakpoint in the actionbar and enter the condition in the dialog that is displayed.

Line breakpoints can be set and unset using the actionbar or by clicking in the line number column to the left of the selected line.

The Breakpoints grid shows the filename and line number for currently set breakpoints. Double-clicking on a grid row will clear that breakpoint.
Click Remove All Breakpoints in the actionbar to clear all current breakpoints.

From v8.0, click Deactivate Breakpoints in the actionbar to disable breakpoints without removing them. Breakpoints can also be enabled/disabled using the SET BREAKPOINT command.

Watches
Watches (or 'watchpoints') cause execution of the running program to pause after the value of a field or memory variable set as a watchpoint changes. Watches are set using the actionbar:

The Watchpoints grid shows the name, data type and current value for currently set watchpoints. Double-clicking on a grid row will clear that watchpoint.

Click Remove All Watches in the actionbar to clear all current watchpoints.

From v8.0, click Deactivate watchpoints in the actionbar to disable watchpoints without removing them.

Call Stack
The Call Stack grid shows the filename and line number for each program in the current stack.

Globals
The Globals grid shows the name, type and value of current public variables.
Locals
The Locals grid shows the name, type and value of current local and private variables.

Actionbar
| Action | Description |
|---|---|
| Run/Continue | Run or continue running the program to the next breakpoint or watchpoint or to the end if no breakpoints or watchpoints are set. |
| Stop | Stop debugging. From v6.0 this also cancels the execution of the program. |
| Edit Code | Put the currently selected file into edit mode. |
| Save Code | Displayed when edit mode (Edit Code above) has been selected. Click to save any changes and exit edit mode. |
| Revert Code | Displayed when edit mode (Edit Code above) has been selected. Click to cancel any changes and exit edit mode. |
| Refresh all files | Refresh all files in the debugger. This will update them with any changes made using the Script Editor in the Apps Workspace or Library Workspace. |
| Step Over | Move to the next line of code without running the current line. |
| Step Into | Run the current line of code then move to the next line. |
| Step Out | Run until returning to the calling program, then move to the next line. |
| Add Conditional Breakpoint | Set a conditional breakpoint on a specified condition. A dialog will be displayed so the condition can be entered. |
| Toggle Breakpoint | Set a breakpoint on the current line, or unset the breakpoint if one already exists. |
| Toggle Watch | Set a watchpoint on the currently selected variable or field, or unset the watchpoint if one already exists. |
| Remove All Breakpoints | Remove all breakpoints. |
| Remove All Watches | Remove all watchpoints. |
| Deactivate/Activate Breakpoints | Disable or enable breakpoints. From v8.0. |
| Deactivate/Activate Watchpoints | Disable or enable watchpoints. From v8.0. |
| List Status | List the current data environment in the Output window. |
| List Memory | List the current memory variables in the Output window. |
| List Structure | List the structure of the currently selected table or cursor in the Output window. |
| Clear | Clear the Output window. |
See Also
Command Window, Error Handling and Debugging, Script Editor, SET BREAKPOINT