Difference between revisions of "Debug Tab"
Yvonne.milne (Talk | contribs) (→Activating the Debugger) |
Yvonne.milne (Talk | contribs) (→The Debug Tab) |
||
| Line 14: | Line 14: | ||
==The Debug Tab== | ==The Debug Tab== | ||
| − | The Debug Tab contains the Lianja/VFP | + | The Debug Tab contains the Lianja/VFP Debugger. The tabbed upper container contains an output panel and the files currently loaded in the Debugger. The lower tabbed container contains the following: |
| + | |||
| + | * Command Window | ||
| + | * Breakpoints Grid | ||
| + | * Watches Grid | ||
| + | * Call Stack Grid | ||
| + | * Errors Window | ||
| + | * Log Window | ||
| + | |||
| + | Below these are a message line showing the current operation and an actionbar. | ||
===Activating the Debugger=== | ===Activating the Debugger=== | ||
| Line 22: | Line 31: | ||
* Clicking on '''Debug''' in the [[Media:Getstart1_2.png|Modebar]] (opens the Debug Tab undocked). | * Clicking on '''Debug''' in the [[Media:Getstart1_2.png|Modebar]] (opens the Debug Tab undocked). | ||
* Automatically, when a running program issues the [[DEBUGGER|debugger]] command. | * Automatically, when a running program issues the [[DEBUGGER|debugger]] command. | ||
| − | * Issuing the command [[DEBUG|debug]] ''< | + | * Issuing the command [[DEBUG|debug]] ''<filename>'' or [[DEBUGGER|debugger]] ''<filename>'' in the Lianja/VFP Command Window ([[Console Tab]], [[Console Workspace]] or [[Command Window]]). |
| + | |||
| + | ===Loading Files in the Debugger=== | ||
| + | Programs containing the [[DEBUGGER|debugger]] command or specified with the [[DEBUG|debug]] ''<prg-filename>'' or [[DEBUGGER|debugger]] ''<prg-filename>'' commands are automatically loaded into the debugger when the command is issued. | ||
| + | |||
| + | Programs can also be loaded from the [[Apps Workspace]]. Open the file (double-click the filename) in the [[Script Editor]] then click the '''Open file in Debugger''' toolbutton. | ||
| + | |||
| + | [[{{ns:file}}:apps_open_in_debugger.png|800px|left|link={{filepath:apps_open_in_debugger.png}}|Open file in Debugger]] | ||
| + | <br clear=all> | ||
| + | |||
| + | Select the Debug Tab or click '''Debug''' in the [[Media:Getstart1_2.png|Modebar]] to debug the file. | ||
| + | |||
| + | Called programs are automatically loaded when referenced by a program being debugged and 'Step Into' is clicked. | ||
===Breakpoints=== | ===Breakpoints=== | ||
| Line 33: | Line 54: | ||
===Log=== | ===Log=== | ||
| + | |||
| + | ===Actionbar=== | ||
| + | |||
| + | {| class="wikitable" width="100%" | ||
| + | !width="30%"|Action | ||
| + | !width="70%"|Description | ||
| + | |- | ||
| + | |valign="top"|Run/Continue | ||
| + | |valign="top"| | ||
| + | |- | ||
| + | |valign="top"|Stop | ||
| + | |valign="top"| | ||
| + | |- | ||
| + | |valign="top"|Edit Code | ||
| + | |valign="top"| | ||
| + | |- | ||
| + | |valign="top"|Refresh all files | ||
| + | |valign="top"| | ||
| + | |- | ||
| + | |valign="top"|Step Over | ||
| + | |valign="top"| | ||
| + | |- | ||
| + | |valign="top"|Step Into | ||
| + | |valign="top"| | ||
| + | |- | ||
| + | |valign="top"|Step Out | ||
| + | |valign="top"| | ||
| + | |- | ||
| + | |valign="top"|Toggle Breakpoint | ||
| + | |valign="top"| | ||
| + | |- | ||
| + | |valign="top"|Toggle Watch | ||
| + | |valign="top"| | ||
| + | |- | ||
| + | |valign="top"|Remove All Breakpoints | ||
| + | |valign="top"| | ||
| + | |- | ||
| + | |valign="top"|Remove All Watches | ||
| + | |valign="top"| | ||
| + | |- | ||
| + | |valign="top"|List Status | ||
| + | |valign="top"|[[LIST STATUS|Lists the current data environment]] in the Output window. | ||
| + | |- | ||
| + | |valign="top"|List Memory | ||
| + | |valign="top"|[[LIST MEMORY|Lists the current memory variables]] in the Output window. | ||
| + | |- | ||
| + | |valign="top"|List Structure | ||
| + | |valign="top"|[[LIST STRUCTURE|Lists the structure]] of the currently selected table or cursor in the Output window. | ||
| + | |- | ||
| + | |} | ||
| + | |||
===Dock Tab=== | ===Dock Tab=== | ||
Revision as of 11:09, 17 January 2018
Under Construction
Contents
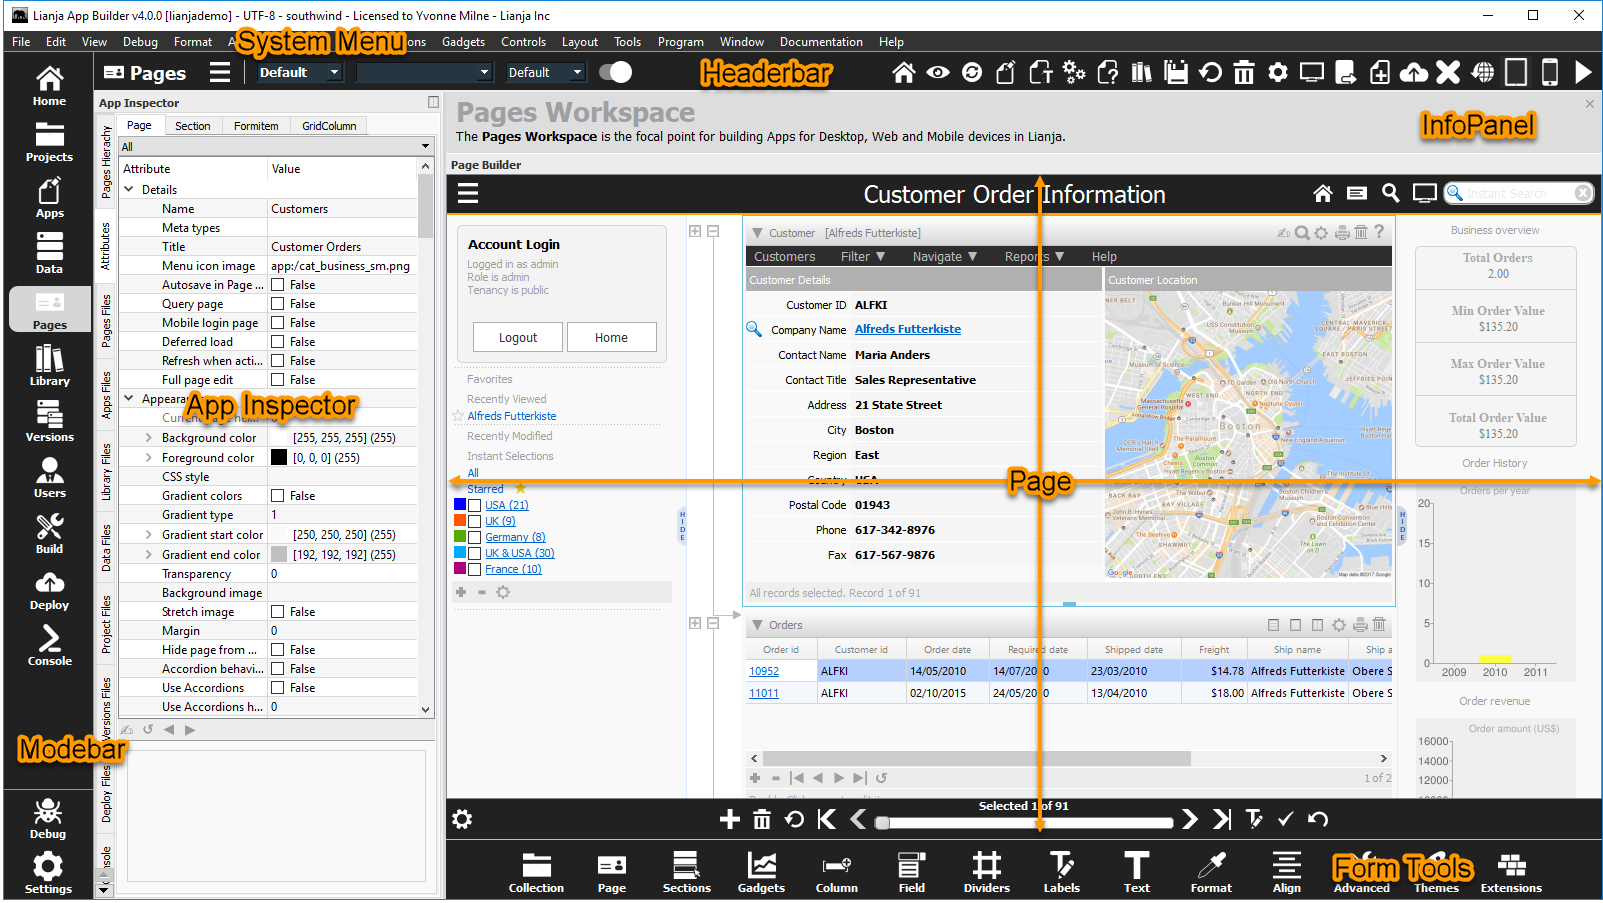
The App Inspector
The App Inspector is your best friend during development as it provides a complete overview of your App.
It is organized into Tabs. Each Tab is relevant to a particular workspace. You can double click a Tab to detach it into its own floating window.
Clicking the small icon on the far right of the App Inspector title bar will detach it into its own floating window.
Double clicking the window title bar when it is floating will attach it back into place.

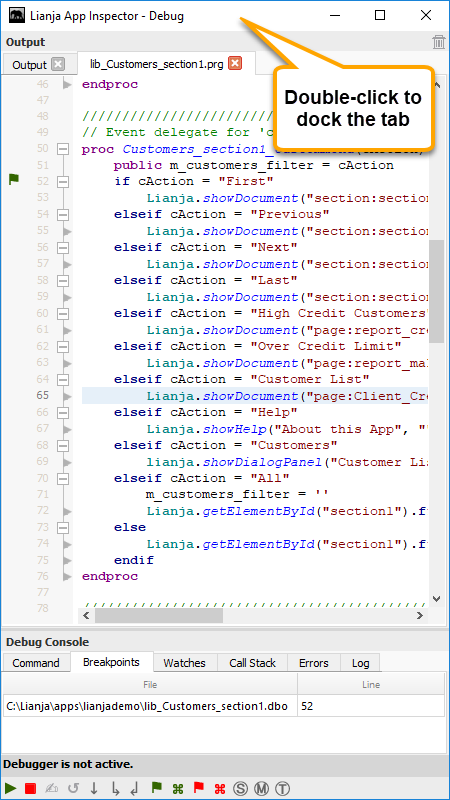
The Debug Tab
The Debug Tab contains the Lianja/VFP Debugger. The tabbed upper container contains an output panel and the files currently loaded in the Debugger. The lower tabbed container contains the following:
- Command Window
- Breakpoints Grid
- Watches Grid
- Call Stack Grid
- Errors Window
- Log Window
Below these are a message line showing the current operation and an actionbar.
Activating the Debugger
As with all App Inspector tabs, the Debug Tab can be selected by clicking on its tab and double-clicking on the tab undocks it into its own floating window.
It can also be opened in the following ways:
- Clicking on Debug in the Modebar (opens the Debug Tab undocked).
- Automatically, when a running program issues the debugger command.
- Issuing the command debug <filename> or debugger <filename> in the Lianja/VFP Command Window (Console Tab, Console Workspace or Command Window).
Loading Files in the Debugger
Programs containing the debugger command or specified with the debug <prg-filename> or debugger <prg-filename> commands are automatically loaded into the debugger when the command is issued.
Programs can also be loaded from the Apps Workspace. Open the file (double-click the filename) in the Script Editor then click the Open file in Debugger toolbutton.

Select the Debug Tab or click Debug in the Modebar to debug the file.
Called programs are automatically loaded when referenced by a program being debugged and 'Step Into' is clicked.
Breakpoints
Watches
Call Stack
Errors
Log
Actionbar
| Action | Description |
|---|---|
| Run/Continue | |
| Stop | |
| Edit Code | |
| Refresh all files | |
| Step Over | |
| Step Into | |
| Step Out | |
| Toggle Breakpoint | |
| Toggle Watch | |
| Remove All Breakpoints | |
| Remove All Watches | |
| List Status | Lists the current data environment in the Output window. |
| List Memory | Lists the current memory variables in the Output window. |
| List Structure | Lists the structure of the currently selected table or cursor in the Output window. |
Dock Tab
To dock the tab back in the App Inspector, click the [x] or double-click the window title bar.