Difference between revisions of "Debug Tab"
From Lianjapedia
Yvonne.milne (Talk | contribs) |
Yvonne.milne (Talk | contribs) (→The Debug Tab) |
||
| Line 14: | Line 14: | ||
==The Debug Tab== | ==The Debug Tab== | ||
| − | The Debug Tab | + | The Debug Tab contains the Lianja/VFP debugger. |
| + | |||
| + | ===Activating the Debugger=== | ||
| + | |||
| + | ===Breakpoints=== | ||
| + | |||
| + | ===Watches=== | ||
| + | |||
| + | ===Call Stack=== | ||
| + | |||
| + | ===Errors=== | ||
| + | |||
| + | ===Log=== | ||
===Dock Tab=== | ===Dock Tab=== | ||
Revision as of 13:28, 15 January 2018
Under Construction
Contents
The App Inspector
The App Inspector is your best friend during development as it provides a complete overview of your App.
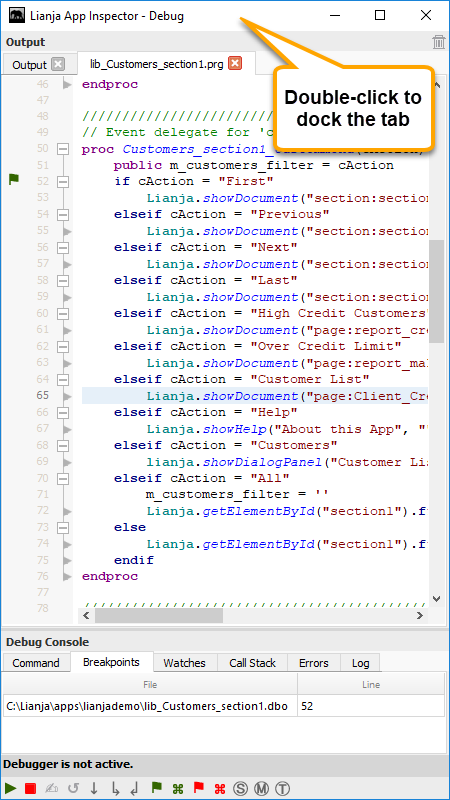
It is organized into Tabs. Each Tab is relevant to a particular workspace. You can double click a Tab to detach it into its own floating window.
Clicking the small icon on the far right of the App Inspector title bar will detach it into its own floating window.
Double clicking the window title bar when it is floating will attach it back into place.

The Debug Tab
The Debug Tab contains the Lianja/VFP debugger.
Activating the Debugger
Breakpoints
Watches
Call Stack
Errors
Log
Dock Tab
To dock the tab back in the App Inspector, click the [x] or double-click the window title bar.