It's possible to SET DEBUG ON and SET DEBUGTRACE ON when running from the App Center. Simply add it someplace like the Init delagate for the App. That way you'll at least get the debug files.
try deleting any .dbo files from your app's directory and the ./library/ directory and see if that changes the behavior.
Try adding a LIST STATUS TO FILE <filename> before the MESSAGEBOX() and see if everything in there is as you expect.
Have you tried issuing SET DEBUG ON and checking the log in the ./debug/ directory for more information? Issue it in the console before you open your app.
If you could SET DEBUG ON, make your ODBC connection from the console, USE this table, then post the resulting debug file
Can you switch to the lib_search.prg tab in the debugger?
If there is an error in search.rsp, there should be an errorxxxx.mem in lianja\error.
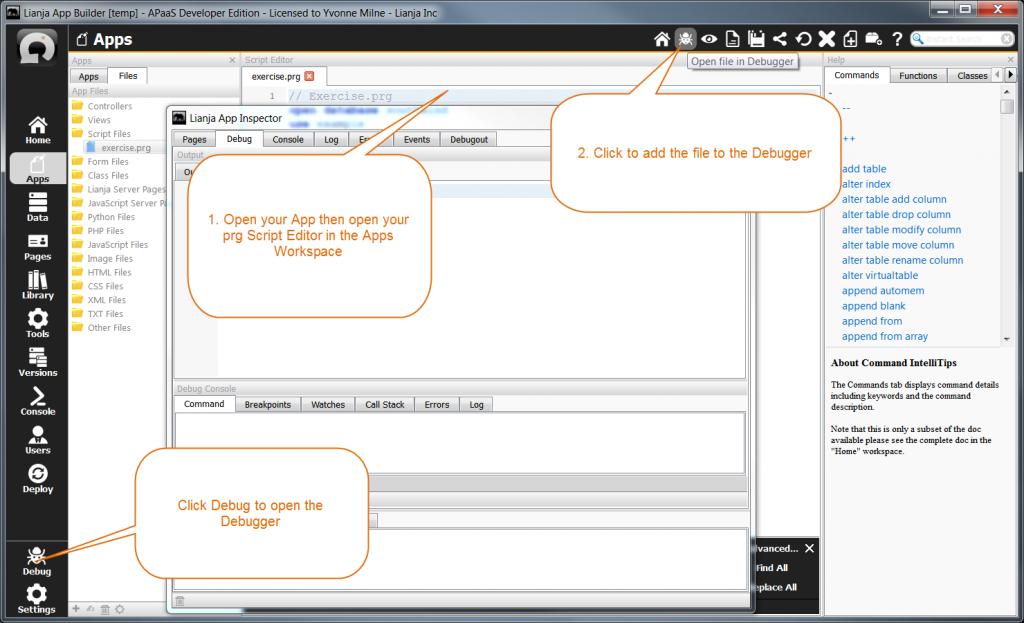
If you open the script in the Script Editor, you can click the Debugger button in the Headerbar to load it into the Debugger.
Q:
It appears that the app debugger (icon in IDE left bottom) is only for debugging Recital script pages (prg?)
A:
yes, the full Desktop App 'Debug' debugger is for debugging Lianja/VFP scripts.
You can use the JavaScript command window tab in the Console or the App Inspector
switch debug on in the Console Workspace Lianja/VFP Command Window:
Then open an App and attempt an update.
Then in the Console Workspace, Lianja/VFP command window:
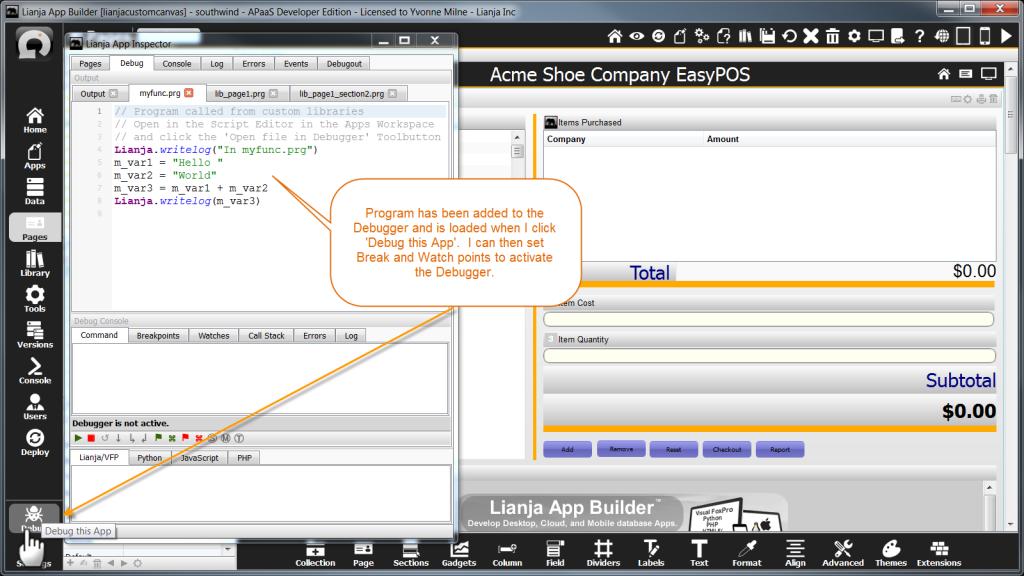
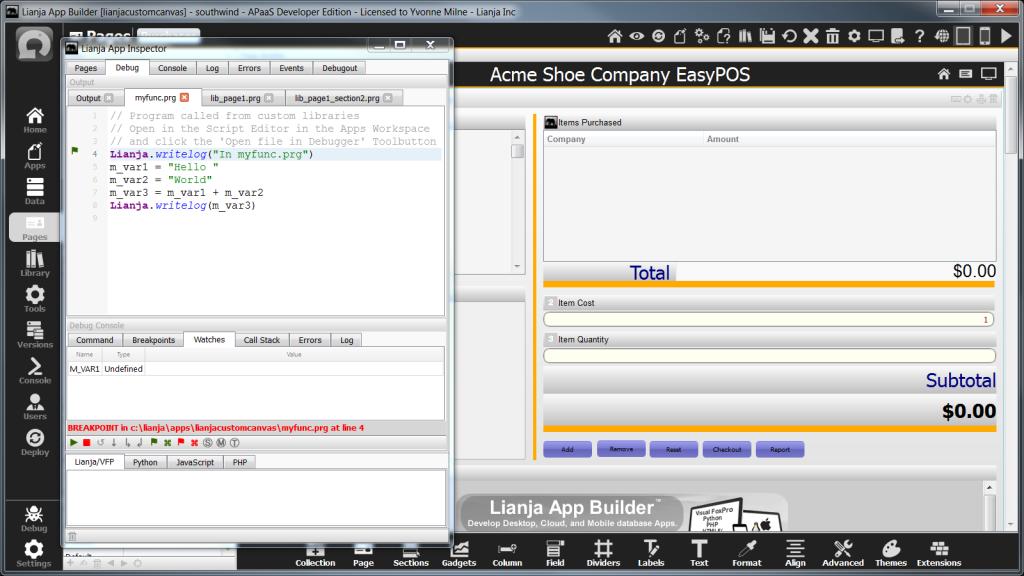
If you are debugging an App, just load the App and click the 'Debug this App' button in the ModeBar. This will automatically load any custom libraries referenced by the UI Controls. For example, in the lianjacustomcanvas App included in the Lianja App Builder distribution, the 'page1' Page references lib_page1.prg and the 'section2' Section references lib_page1_section2.prg.

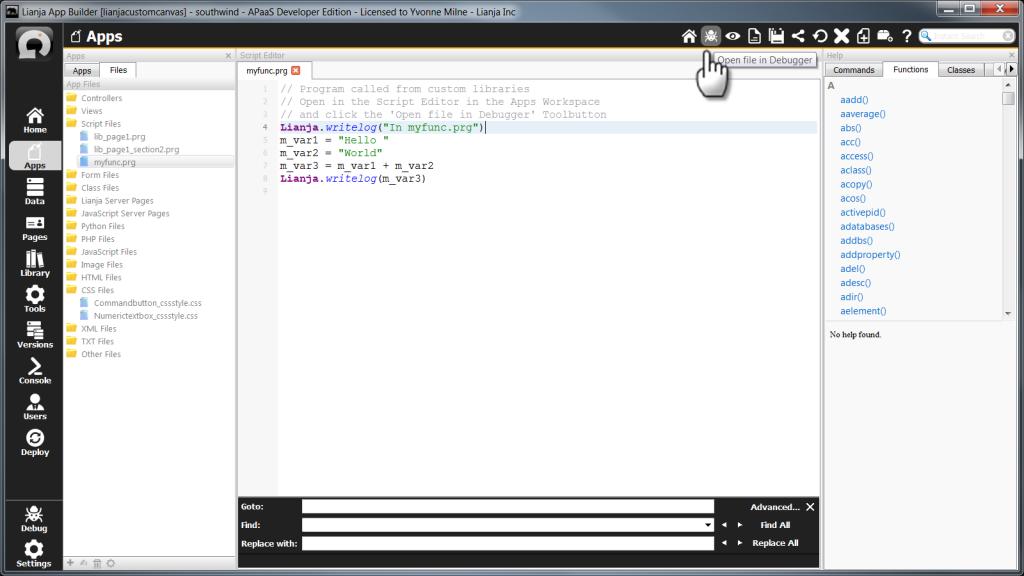
I've created a program called myfunc.prg and it is referenced from lib_page1_section2.prg. If I want this to be loaded along with the custom libraries when I open the Debugger, I open it in the Script Editor in the Apps Workspace and click the 'Open file in Debugger' button:
Now when I click the 'Debug this App' button in the ModeBar, myfunc.prg is also immediately available in the Debugger, not just when it is called while the Debugger is active and 'Step Into' used.
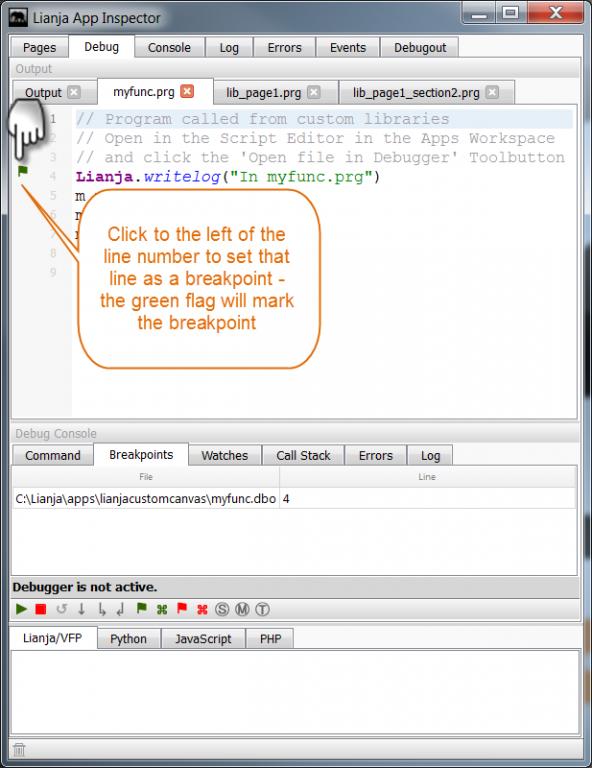
With my 'myfunc.prg' program loaded in the Debugger, I can set Watch and Break points and continue running the App until one of these is reached.
I click next to the line number to make a line a Breakpoint:
And select/highlight the name of a variable then click 'Watch' to set a Watchpoint on a variable:
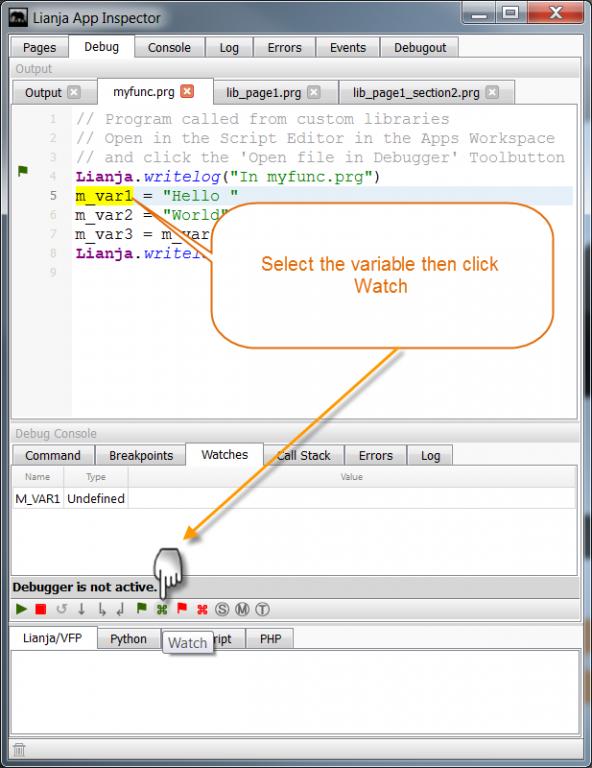
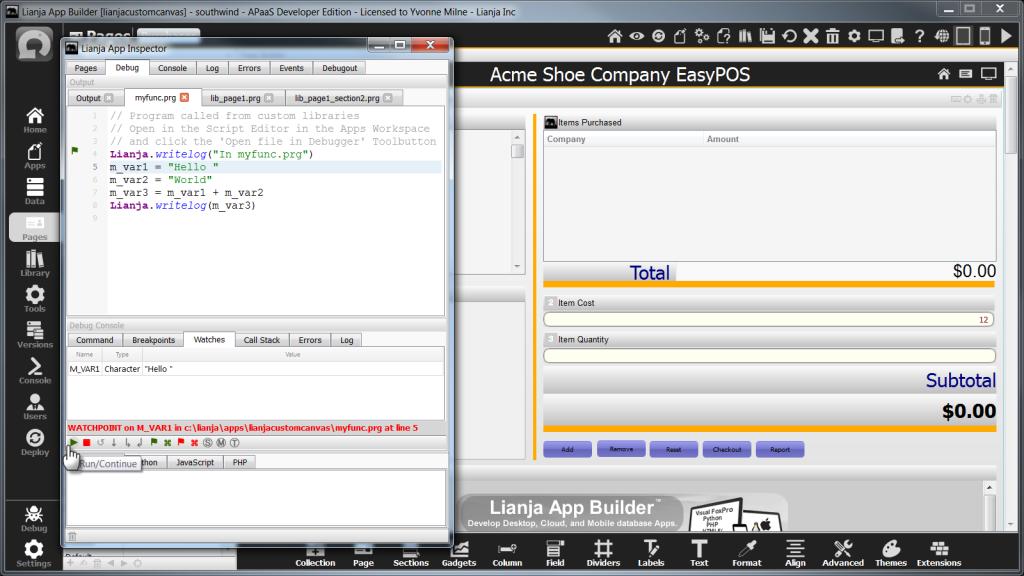
I can then run the App and the Debugger activates when a Breakpoint or Watchpoint is reached:
At which time, I can step individual lines, or click 'Run/Continue' so that the App continues until another Breakpoint or Watchpoint is reached.
Q:
If my program file is named "exercise.prg"; then I must use debug excercise.prg?
Like
Set Debug On
Debug excercise.prg
Do excercise.prg
A:
You can, or you can load it into the Debugger like this:
You can enable debugging for the Lianja App Center as follows (please remember to switch it off after you've tracked down the error):
Create a text file called 'config.db' in C:\Lianja\conf and edit it to contain the line
This is the equivalent of setting debug on from the Console Workspace in the Lianja App Builder, so check for any information logged into C:\Lianja\debug\*.txt.
I should also mention that that will be a system-wide setting while enabled - so will also apply to a Lianja App Builder on the same machine.
In the Console, switch debug logging on:
Then do your updates, exit the App Builder and have a look at the files in Lianja\debug to see if any errors are reported.
Can you put a LIST STATUS just before that to show what tables are already open?
Specify a target for the SELECT - at the moment it will just be going to the Console Output Window as standard output.
For example, save it to a cursor:
Code:
SELECT PENALTYDESC ;
FROM bantam_stats!penalties ;
WHERE teamid = intTeamID AND playernumber = intPlayerNumber;
into cursor cPenalties

messagebox(penaltydesc)
or into a memory variable:
Code:
SELECT PENALTYDESC ;
FROM bantam_stats!penalties ;
WHERE teamid = intTeamID AND playernumber = intPlayerNumber into cPenaltydesc

messagebox(cPenaltydesc)
there is no debugger for javascript.
You can use Lianja.writeOutput() then open the app inspector, switch to runtime mode then look in the events tab and the output.
All topics in [Answers] alphabetically: http://www.lianja.com/community/show...ll=1#post12352
This same topic is extended to another thread: http://www.lianja.com/community/show...nswers-Debug-2


 Reply With Quote
Bookmarks