Difference between revisions of "Troubleshooter Profiler Metrics Tab"
From Lianjapedia
Yvonne.milne (Talk | contribs) |
Yvonne.milne (Talk | contribs) |
||
| Line 1: | Line 1: | ||
| − | |||
| − | |||
==The Troubleshooter== | ==The Troubleshooter== | ||
The Troubleshooter provides a tabbed interface bringing together debugging, tracing and performance metrics to assist you in testing and tuning your Apps. | The Troubleshooter provides a tabbed interface bringing together debugging, tracing and performance metrics to assist you in testing and tuning your Apps. | ||
Latest revision as of 09:00, 6 December 2019
The Troubleshooter
The Troubleshooter provides a tabbed interface bringing together debugging, tracing and performance metrics to assist you in testing and tuning your Apps.

The Profiler Metrics Tab
The Profiler Metrics Tab displays Profiler environment settings and data when a Lianja/VFP prg script is profiled in the Apps Workspace.
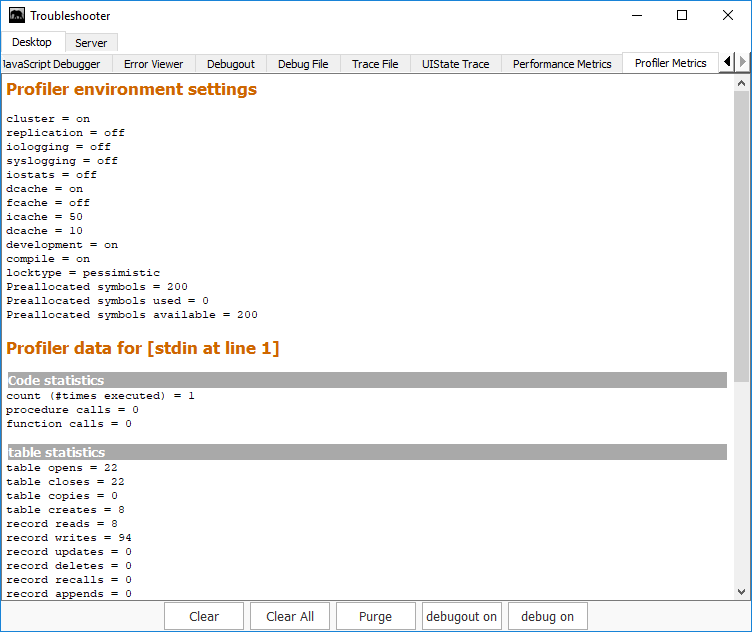
Note: The Apps Workspace Profile File toolbutton can only be used on standalone prg files, not procedure libraries.
For more on profiling functionality and environment settings, see these commands: CLEAR PROFILE, DISPLAY PROFILE, LIST PROFILE, PROFILE, SET DCACHE, SET ICACHE, SET IOLOGGING, SET IOSTATS, SET PROFILE