Error Handling and Debugging
Debugging is one of the most important skills for a developer. Software development is all about writing code, making mistakes, and fixing them.
Strong debugging skills minimize the development cycle by allowing developers to pinpoint bugs quicker, make fixes that actually address the problems encountered, and verify the modifications are correct. This is particularly important as the code gets more complex.
Lianja App Builder is quite unique in that as you develop an App you are working directly on live data running live dynamically compiled code. This development paradigm encourages agile development and to assist you further, Lianja App Builder provides some very powerful graphical debugging tools for you to use.
Debugging
Lianja/VFP Debugging
The App Inspector
The App Inspector is your best friend during development as it provides a complete overview of your App.
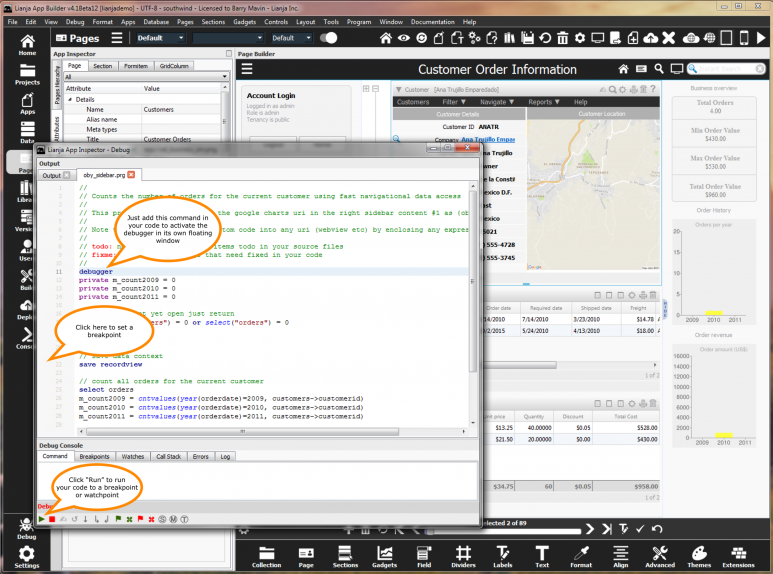
Inside the App Inspector you will find the Debug Tab containing the Lianja/VFP debugger.
You can double click this tab to detach it from the App Inspector into its own floating window.
The Lianja/VFP Debugger
To debug any of your Lianja/VFP code e.g. in a custom delegate, just add this command in the code where you want to break into the debugger:
debugger
This will activate the Lianja/VFP debugger and undock it from the App inspector. Just double click its title bar or close its window and it will be redocked into the App Inspector.
Additional Lianja/VFP Debugging Techniques
DEBUGOUT
With SET DEBUGOUT ON, the DEBUGOUT command can be used to log text messages to the debug.txt file in the Lianja debug sub-directory. The DEBUGOUT command is ignored if SET DEBUGOUT is OFF.
// debugdoc.prg
set debugout on
debugout "about to open database"
open database southwind
debugout "about to open table"
use example
replace all available with limit - balance
debugout "after replace"
close databases
debugout "after close data"
set debugout off
// Following line will not be logged:
debugout "no need to log this"
// end
debug.txt contents:
Debugout called from DEBUGDOC at line 3: about to open database
Debugout called from DEBUGDOC at line 5: about to open table
Debugout called from DEBUGDOC at line 8: after replace
Debugout called from DEBUGDOC at line 10: after close data
SET DEBUG ON
With SET DEBUG ON, debugging and error information is logged to the debug text file in the lianja debug sub-directory. By default, SET DEBUG is OFF. The debugging information will contain a valuable insight into the internal code so when trying to track down a hard to locate bug SET DEBUG ON may be your life saver.
SET DEBUGTRACE ON
With SET DEBUGTRACE ON, a trace of command execution is included in the debug text file output when SET DEBUG is ON. By default, SET DEBUGTRACE is OFF.
SET DEBUGCOMPILE ON
With SET DEBUGCOMPILE ON, the compiler includes debugging information in the compiled code file. This information is then output to the debug text file in the lianja debug sub-directory when the program is run with SET DEBUG ON. By default, SET DEBUGCOMPILE is OFF.
SET ERRORLOGGING ON
With SET ERRORLOGGING ON, errors are logged to the debug text file in the lianja debug sub-directory. By default, SET ERRORLOGGING is ON.
Lianja.writeOutput()
This is a convenience method on the Lianja system object that will write to the output log at development time. When used in Web/Mobile Apps it will write to the console. It is the equivalent to console.log() but cross platform and cross language.
Lianja.writeError()
This is a convenience method on the Lianja system object that will write to the error log at development time. When used in Web/Mobile Apps it will write to the console. It is the equivalent to console.error() but cross platform and cross language.
JavaScript Debugging
The JavaScript Debugger
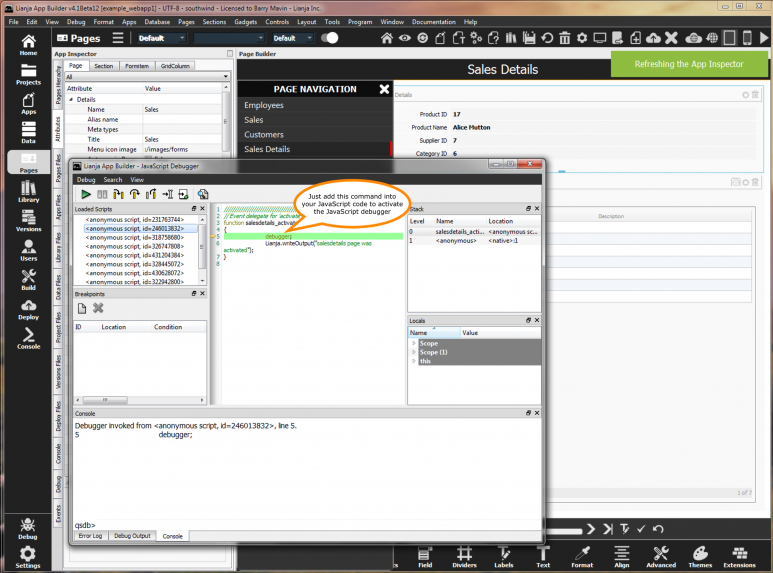
To debug any of your JavaScript code e.g. in a custom delegate, just add this command in your JavaScript custom delegate code where you want to break into the debugger:
debugger;
This will activate the JavaScript debugger. Just close its window when you are finished with it.
When debugging Web Apps you need to right click on the App in debug mode and select Inspect.
This is a security "feature" of modern browsers to prevent web sites from hijacking the browser window.
Additional JavaScript Debugging Techniques
Lianja.writeOutput()
This is a convenience method on the Lianja system object that will write to the output log at development time. When used in Web/Mobile Apps it will write to the console. It is the equivalent to console.log() but cross platform and cross language.
Lianja.writeError()
This is a convenience method on the Lianja system object that will write to the error log at development time. When used in Web/Mobile Apps it will write to the console. It is the equivalent to console.error() but cross platform and cross language.
Error Handling
Lianja/VFP Error Handling
Exception Handling
TRY...CATCH...FINALLY is a command structure to handle errors and exceptions within a block of code. The <tryCommands> which follow the TRY statement are executed. If no error occurs in the <tryCommands> program execution continues from the FINALLY statement. If an error occurs, program execution jumps immediately to the CATCH statement. RETURN statements should not be issued within a TRY... ENDTRY block.
try
    use example exclusive
catch
    messageBox("Unable to open example table")
endtry

//Another example
try
    use example exclusive
catch to oExc
    if oExc.message = "ALIAS name already in use"
        select example
        exit
    else
        messageBox("Unable to open example table")
    endif
endtry

//Another example
try
    ? [Outer Try]
    try
        use example exclusive
    catch to oExc
        oExc.UserValue = "Nested CATCH message: Unable to handle"
        ?[: Nested Catch]
        ?[  Inner Exception Object: ]
        ?[  Error: ] + str(oExc.ErrorNo)
        ?[  LineNo: ] + str(oExc.LineNo)
        ?[  Message: ] + oExc.Message
        ?[  Procedure: ] + oExc.Procedure
        ?[  StackLevel: ] + str(oExc.StackLevel)
        ?[  LineContents: ] + oExc.LineContents
        ?[  UserValue: ] + oExc.UserValue
        throw oExc
    finally
        ?[: Nested FINALLY executed ]
    endtry
catch to oExc1
    ?[: Outer CATCH ]
    ?[  Outer Exception Object: ]
    ?[  Error: ] + str(oExc1.ErrorNo)
    ?[  LineNo: ] + str(oExc1.LineNo)
    ?[  Message: ] + oExc1.Message
    ?[  Procedure: ] + oExc1.Procedure
    ?[  StackLevel: ] + str(oExc1.StackLevel)
    ?[  LineContents: ] + oExc1.LineContents
    ?[  ->UserValue becomes inner exception THROWn from nested TRY/CATCH ]
    if oExc1.UserValue.Message = "ALIAS name already in use"
        select example
    endif
finally
?[: FINALLY executed ]
endtry
JavaScript Error Handling
Exception Handling
The try...catch statement marks a block of statements to try, and specifies a response, should an exception be thrown.
try {
   throw 'myException'; // generates an exception
}
catch (e) {
   // statements to handle any exceptions
   logMyErrors(e); // pass exception object to error handler
}
Pages in category "Error Handling"
The following 37 pages are in this category, out of 37 total.
ABCDE |
E cont.LMORS |
S cont.T |

